
What if you had a crystal ball for your Amazon business, one that answered your most pressing questions about customer behavior? The good news is, you already do. It's called Amazon Brand Analytics, and learning to interpret its data is the key to scaling your brand from seven to eight figures and beyond. Understanding this data is simpler than you think and provides a direct path to more profitable decisions.
To master your brand's performance, you can use five simple ways to understand Amazon Analytics. These involve leveraging five key dashboards: Search Query Performance for keyword insights, Market Basket Analysis for cross-selling, Repeat Purchase Behavior for loyalty, Demographics for audience targeting, and the new Search Catalog Performance to optimize your entire customer journey. These tools give you aggregated customer data to make strategic decisions that drive growth.
Amazon Brand Analytics is a suite of powerful reporting tools available exclusively to brand owners enrolled in Amazon's Brand Registry program. It provides a wealth of invaluable, aggregated data directly from Amazon about customer search and purchase behavior. Unlike standard Seller Central reports that focus on your own sales and operations, Brand Analytics gives you a market-level view of how customers discover, consider, and purchase products, including your competitors'.
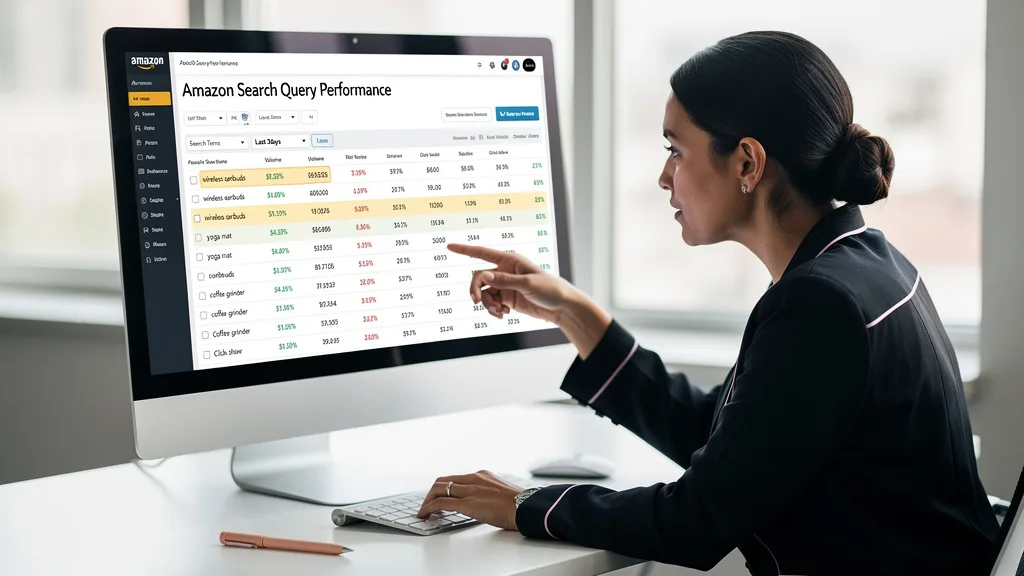
This powerful feature helps businesses better understand the entire customer journey. It provides insights into which search terms are driving traffic, what other products your customers are buying, and the demographic makeup of your audience. By analyzing this brand performance data, you can make smarter, data-backed strategic decisions regarding your product listings, advertising campaigns, and overall brand strategy to effectively grow your business on the platform.
How to Access Your Amazon Brand Analytics Data
Accessing your data is straightforward once you are enrolled in Amazon Brand Registry. If your brand is registered, the analytics dashboards are just a few clicks away inside your Seller Central account. This access is a significant advantage of becoming a registered brand and is crucial for any serious seller looking to compete effectively in 2026.

To find your dashboards, log in to your Amazon Seller Central account. Navigate to the main menu and hover over the 'Brands' tab. From the dropdown menu that appears, select 'Brand Analytics'. This will take you to the main dashboard, where you can explore all the different reports Amazon offers, including Search Query Performance, Market Basket Analysis, and more. It's the central hub for all customer behavior insights.
5 Key Dashboards for Understanding Amazon Analytics
Navigating the wealth of data Amazon provides can feel overwhelming, but focusing on five core dashboards will give you the most impactful insights for growing your brand. Each report offers a unique window into your customers' minds and shopping habits. By regularly reviewing these five areas, you can build a comprehensive understanding of your market position and identify clear opportunities for optimization and growth. This focused approach prevents data overload and ensures your time is spent on analysis that leads to action.

These dashboards are your roadmap to better keyword targeting, smarter product bundling, increased customer loyalty, and more effective advertising. They transform abstract data into a concrete action plan. Mastering these reports is a foundational step for any brand owner aiming to scale their business profitably on Amazon. The table below outlines these key reports and their primary function for your brand.
| Dashboard | Primary Use Case | Key Business Question Answered |
|---|---|---|
| Search Query Performance | Keyword Research & SEO | What search terms are customers using to find my products and my competitors'? |
| Market Basket Analysis | Cross-selling & Bundling | What other products are my customers buying at the same time? |
| Repeat Purchase Behavior | Customer Loyalty & LTV | Are my customers coming back to buy from me again? |
| Demographics | Audience Targeting | Who is my typical customer (age, income, gender, etc.)? |
| Search Catalog Performance | Listing & Funnel Optimization | Where in the shopping journey are customers dropping off? |
1. Analyze Search Query Performance for Keyword Insights
The Search Query Performance dashboard is your go-to source for understanding exactly how customers are searching for products in your category. It reveals the top search terms relevant to your products, showing their search frequency rank, and your brand's share of clicks and conversions for each term. This is a goldmine for discovering high-intent keywords you may have missed in your initial research.
By analyzing this data, you can refine your listing's title, bullet points, and backend search terms to align with actual customer language. This directly improves your organic ranking and the relevance of your PPC ad campaigns. For a deeper dive into ranking your products, review a comprehensive Amazon SEO guide to ensure your listings are fully optimized to capture this search traffic.
2. Use Market Basket Analysis for Cross-Selling Opportunities
The Market Basket Analysis report shows the top three products most frequently purchased at the same time as your product. This is essentially Amazon telling you what your customers believe should be bundled together. Understanding these purchasing combinations provides powerful insights into customer needs and opens up significant opportunities for cross-selling and strategic bundling.
Use this data to create virtual bundles, inform your 'Frequently Bought Together' strategy, and target your own complementary products in Product Targeting PPC ads. For example, if customers frequently buy a specific accessory with your main product, you can create a bundle offer that increases the average order value. This is a direct way to boost revenue per customer by leveraging existing buying patterns.
3. Study Repeat Purchase Behavior to Boost Customer Loyalty
The Repeat Purchase Behavior dashboard is critical for brands with consumable products or those looking to build long-term customer relationships. This report shows you the number of orders and unique customers for your products over a selected time frame, highlighting how many of those orders come from repeat customers. It's a direct measure of customer loyalty and satisfaction.
A high repeat purchase rate indicates a healthy brand with a strong product-market fit. You can use this data to measure the impact of loyalty initiatives, such as email follow-up campaigns or improvements in product quality. It also helps in forecasting future sales more accurately and understanding the true lifetime value of your customers, which is essential for planning a successful Prime Day advertising strategy and beyond.
4. Leverage Demographics Data to Refine Your Audience Targeting
The Demographics dashboard provides aggregated data about the customers who purchase your products, including their age, household income, education level, gender, and marital status. This information allows you to build a detailed persona of your ideal customer, moving beyond assumptions to data-backed facts. Knowing who your customer is allows you to speak their language.
This data is invaluable for refining your brand voice, imagery, and marketing messages to resonate more deeply with your target audience. Most importantly, you can use these demographic insights to create highly targeted Amazon PPC campaigns, ensuring your ad spend is focused on the most relevant shoppers. Understanding your audience helps you manage your Amazon PPC cost more effectively by reducing wasted ad spend on irrelevant audiences.
5. Optimize Listings with Search Catalog Performance Data
The Search Catalog Performance dashboard is one of the newer and more powerful tools, giving you a complete funnel view of your products' performance from discovery to purchase. It shows metrics at each stage: the number of impressions (when your product appeared in search), clicks, add-to-carts, and purchases. This allows you to pinpoint exactly where you are losing potential customers in the shopping journey.
If you have high impressions but low clicks, your main image or title may need work. If you have high clicks but few add-to-carts, the issue could be your price, bullet points, or customer reviews. By diagnosing the bottleneck, you can focus your optimization efforts where they will have the most impact. This granular data is essential for a comprehensive Amazon listing optimization strategy and turning browsers into buyers.
Turning Brand Performance Data Into Strategic Decisions
Collecting data is only the first step; the real value comes from turning those insights into profitable actions. Each dashboard in Amazon Brand Analytics provides a piece of the puzzle. Your job is to assemble those pieces to form a complete picture of your brand's health and market opportunities. For example, insights from Search Query Performance should directly inform your Amazon PPC management, ensuring you're bidding on the most relevant and high-converting terms.
Regularly reviewing this data allows you to move from a reactive to a proactive business strategy. Instead of guessing what customers want, you can use data to anticipate their needs, optimize your marketing spend, and make informed decisions about inventory management and even new product development. A consistent data analysis routine is the hallmark of every successful eight-figure Amazon brand.
"In 2026, the brands that win on Amazon are not the ones with the biggest budgets, but the ones who are best at turning data into decisions. Amazon Analytics is the most powerful, free tool you have to make that happen."
Key Takeaways
- Access is Key: Amazon Brand Analytics is a free and powerful suite of tools available to all brand-registered sellers.
- Focus on Five Dashboards: Master your analytics by focusing on Search Query Performance, Market Basket Analysis, Repeat Purchase Behavior, Demographics, and Search Catalog Performance.
- Keyword Goldmine: Use Search Query Performance to find the exact terms customers use to discover products and optimize your listings and PPC campaigns accordingly.
- Increase Order Value: Leverage Market Basket Analysis to identify smart bundling and cross-selling opportunities that increase average order value.
- Build Loyalty: Monitor Repeat Purchase Behavior to measure customer satisfaction and inform strategies that build long-term brand loyalty.
- Data-Driven Action: The ultimate goal is to turn insights from these reports into concrete strategic decisions that improve your marketing, sales, and profitability.
Frequently Asked Questions
How does Amazon use analytics for its own business operations?
Amazon is a data-driven company at its core. It uses analytics for virtually every aspect of its operations, from supply chain management and inventory forecasting to its famous recommendation engine that personalizes the shopping experience for every user. They analyze purchasing patterns, search queries, and browsing history on a massive scale to optimize logistics, predict demand, and create highly effective marketing and advertising platforms. what's the best tool for.
The Brand Analytics tools are a small, anonymized window into this massive data ecosystem. Amazon provides this to sellers to help them grow, knowing that successful sellers lead to a better customer experience and more sales for the platform as a whole. By using analytics, Amazon creates a more efficient and relevant marketplace for everyone.
What are the main differences between Brand Analytics and standard Seller Central reports?
The primary difference lies in their focus. Standard Seller Central reports (like Sales and Traffic or Business Reports) are inward-facing. They tell you about your own performance: your sales, your traffic, your inventory levels, and your advertising costs. They answer the question, "How is my business doing?"
In contrast, Amazon Brand Analytics is outward-facing and focuses on aggregated customer behavior across the market. It provides insights into pre-purchase activity, like what customers are searching for and which products they consider. It answers the question, "How are customers behaving in my category?" This market-level view, which includes competitor data, is what makes Brand Analytics so uniquely powerful for strategic planning.
What are the top analytics tools for Amazon sellers in 2026?
For any brand-registered seller, the number one tool is Amazon's own Brand Analytics. It's free, integrated, and uses Amazon's direct data. Beyond that, many sellers use third-party software suites that supplement Amazon's data with additional features. Popular all-in-one tools like Helium 10 and Jungle Scout offer robust product research, keyword tracking, and profit analysis features.
Specialized tools are also gaining traction. For example, when considering 5 Best Amazon Product Sales analytics tools, platforms like Nozzle.ai focus heavily on customer lifetime value and advanced PPC analytics. The choice of what's the best tool for Amazon sales data analysis often depends on your brand's specific needs and budget, but the foundation should always be a mastery of the data Amazon provides directly.
How often should I review my Amazon analytics data?
The ideal frequency depends on the report and your specific goals. A good routine is to check key performance indicators on a weekly basis. This includes a quick look at your top search queries in Search Query Performance and your overall sales trends. This allows you to quickly spot any sudden changes or opportunities.
For more strategic analysis, a monthly deep dive is recommended. Once a month, set aside time to thoroughly review all five key dashboards. Look for longer-term trends in market basket data, repeat purchase behavior, and demographics. This monthly review is perfect for planning upcoming promotions, adjusting your advertising strategy, and identifying areas for listing optimization.
Conclusion
Understanding and acting on your Amazon analytics is no longer optional for ambitious brands in 2026; it's the core engine of profitable growth. By consistently reviewing the five key dashboards—Search Query Performance, Market Basket, Repeat Purchases, Demographics, and Search Catalog Performance—you replace guesswork with data-driven certainty. These five simple ways to understand Amazon analytics provide the roadmap to attract more customers, increase their order value, and earn their long-term loyalty.
If you're a 7-figure brand owner ready to scale but feel overwhelmed by the data, you don't have to do it alone. An expert analysis can uncover hidden opportunities and create a clear action plan for growth. Get a professional, in-depth review of your listings and account to identify your biggest opportunities for profit. Request your Free Audit today.